Making dem’ Maps
In late December I decided I wanted to try my hand at procedural map-generation. This is that story.
Code here: https://github.com/DarkPurple141/Maps

I’ve always been fascinated by maps. In every book I’ve ever read maps have helped to bring stories to life in a way that descriptions, and place-names never did total-justice to. They could be as simple as a few lines on a piece of paper, to highly technical documents. Whatever they were I loved them.
After watching part of a fairly nerdy documentary a few months back I started to think about a concept known as procedural world generation; that is, creating random fictional maps/worlds from random stimulus. I had a little bit of time in January to sit down and think about implementing such a concept, and for the last two weeks I’ve been honing and developing a few different versions.
I’d wanted to make a map for a while, but the more I’ve explored things — the deeper I’ve thought about how I could do things differently, better, again — from the way my algorithms determine various kinds of terrain to rendering choices, to colour, to platforms, to sizes and styles. There’s a lot. And I’ve learned a lot. And I’m still learning. Anyway. Below is a few different iterations and some reflections on their development.
Version 1.0 — proof of concept

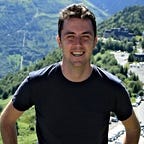
Starting out the most achievable first step was creating a text-symbol print-out of a map-like shape. More or less, that’s the output of the left white on black text. Written in the Python scripting language it’s a very basic algorithm and it uses a grid-lattice for its shape.
The algorithm boils down to using grid co-ordinates to determine most of the key data. A few rules I created as I worked through some initial drafts were:
- I wanted to avoid mountains occurring near the ocean.
- I wanted to ensure the map was an island (ie. could be navigated around by sea).
- Other than that I didn’t give it too much thought.
This was very much a proof of concept rather than thinking too deeply about any of the terrain generation rules. I found a basic tile-set for basic render, and you can see that next to the text-mark-up above. (Rendering has become a limitless area of exploration for me, but you’ll see that more below).
Aside from the simplicity of the algorithm, version 1.0’s major pitfall was that it lacked shape — because of how it was derived from my grid/tile system. It clearly looks very ‘computery’. That was something to be tackled in future versions.
Version 1.1 — refining a broken concept

Version 1.0 wasn’t a complete waste. I developed some nice data structures for holding map elements, and made a little library of basic map functions for future use. They came in handy when I rehashed things in my second major iteration.
This time I really wanted to guarantee shape so I did two things.
- I doubled the width and tripled the height of the exisiting lattice and made each ‘tile sector’ a fraction of its previous size. This allowed for a more granular approach to the overall map.
- I still wanted to keep things fairly simple. I didn’t deal with elevation at all, but again used a sort of random placement of mountain and forest tiles.
The major difference however was that I got interested in tile-sets to supplement the overall look. The nice thing about a tile-set is it simplifies rendering decisions down to placing the right tiles for the right component. Making the rules to govern tile placement however is quite nightmarish.
Here’s a mini-snippet:
After spending a couple of days doing that I decided I was unsatisfied with this approach. It didn’t feel very ‘procedural’, more if-then-elsey. Below is about as good as it got:

The other issue with the above was that I was getting my best results in overall aesthetic by hand-writing out the overall map-design and then getting the computer to parse it appropriately. The rules for terrain generation were still pretty basic, although they were refined.
Version 2.0 — re-thinking things
The biggest problem with both of the above was that I still felt like I was a slave to the grid. Grids are conceptually easy to understand and code, but reek of the artificial. Even by increasing the number of tiles in the above render you can still ‘see’ the grid (okay the river tiles give it a way, but still). I also hated the tiling aspect and felt I was covering up a bad algorithm with prettying tiles. I wanted the algorithm to be smarter, I wanted the maps to be more organic.
— Which brought me back to this excellent dev-site and the introduction of the polygon. I’d looked at some of RedBlob before, but a while back when I was a considerably worse developer and without the know-how to properly think about some of the resources available. I came back to it a week ago, and it’s been tremendously helpful.
First, polygons. Polygons are just multi-sided shapes but using a large polygon count of different sized shapes, you can create more organic looking lattices. Importantly, you move away from the grid. The simplest polygon lattice is the triangle, but that can create sharpe edges. Enter ‘Voronois’.

Voronois are super fascinating shapes generated by a random series of points on a 2D plane. The Voronoi shape << comes from the equidistant edges between any two points. The result is an interesting mixture of differently sized, differently sided shapes. On the scale opposite, it’s kinda pointless, but using a larger number of smaller polygons creates a significantly more organic grid.
I spent a lot of time better understanding Voronois and polygons because while they have an aesthetic advantage over grid squares they’re also less elegant as data structures. I found a brilliant Voronoi library here for Python and began experimenting.
This time I used a radial system to create islands. I used elements of some trig manipulation from RedBlob too and a set static random seed to get better defined behaviour. Below was one of the first iterations of the new algorithm, with a simple ‘SEA_OR_LAND’ output.

Inspired by Martin O’Leary, I found that elevation variation was critical to creating diverse maps and basically just ‘lifted’ a random point on the land multiple times — and then decreasing elevation from that lifted elevation in steps back to ground level. What you end up with is mountainous terrain in some areas (where multiple lifts have affected similar regions of the map) and flatter areas which have missed out on being elevated at all.
Version 2.1 — refining concepts

I liked the ‘amoeba’ opposite quite a bit (basically the end of 2.0), but the colours were off and the shape was too square. The shape was an artefact of 1.0 more or less. I’d worked on creating square images, and that meant I was creating squarish islands. I wanted to extend that out to a normal screen resolution and widen the overall island in 2.1. I also wanted to hone the colours and implement cities, rivers, and roads.
- Rivers need to run down hill and should start at high points on the map. They should be able to merge or split.
- Roads should run along single elevations when possible, and avoid going up too much uphill if a slightly longer lower elevation path is possible.
- Cities should be placed along major arterial rivers, fresh water lakes, or on the coast. More or less in that order.
These were a few different concepts I played with (note the random seed is basically the same for all of the below to maintain the shapes). Although some have higher polygon counts.


Version 3.0 — The future
For the time being I’ve run out of steam. I even implemented a basic name constructor for city names although some of them come out quite nonsense sounding. I wanted to do more complex filtering, but because I was learning so much as I went I got increasingly frustrated with the Python platform I was using and in future will shift to using JavaScript.
The aim was to create something along the lines of Martin O’Leary’s amazing map generation code. I didn’t quite get there. But I was getting closer everyday, and for me the battle will continue once I move over to SVG rendering and JavaScript. On the whole it’s been a fascinating experience, and I’ve learnt a lot from a lot of smart people.
In the future I’d want to generate using moisture and erosion, temperature and elevation together to create ‘biomes’. But that’s a lot more work for another day. If you want to have a more involved look I’ve put most of my code here.
Special thanks to Andrew Bennett, Will Archinal, Amit Patel, Nuno das Neves and Anna Bardsley for their thoughtful advice along the way and bearing with me patiently after showing a few of them version 1.289189182910 of each style.